![]()

While crypto investors often argue over the merit of technical analysis, there’s no denying that Bitcoin price charts and that of other most popular crypto assets – or any asset type for that matter – show repeating chart patterns that may indicate where a market may move next.
Occasionally, the same pattens occur in order of sequence. This occurrence is called a fractal, and are often created by the emotional state of market participants. One prominent crypto analyst has discovered a potential inverse fractal in Bitcoin price charts that may indicate the next strong move in the world of cryptocurrency.
To remove any chance of bullish or bearish bias from their technical analysis, traders will oftentimes view charts in inverse to try and redraw any conclusions from normal price charts. The practice was used by prominent crypto analyst filbfilb, who flipped a Bitcoin price chart on its head to attempt to glean any patterns from the inverse perspective.
The trader discovered a potential inverse fractal that matches the current trading range up closely with the price movements following the June 2018 Bitcoin “bottom” until the November 2018 drop. The 125-day-long zig-zagging price pattern when flipped upside down shows an eerie resemblance, and could indicate that a powerful move to the upside may be in the cards.
The trader’s Twitter commentary accompanying the price charts reminds everyone about the sentiment commonly found amongst the crypto community before the cataclysmic price drop to $3150. At that time, the collective community was convinced that support at $6,000 would be unbreakable, and bullish “hopium” dominated the market.
But after that break below $6,000 bearish sentiment has hit extremes – the complete inverse of the sentiment right before the fall to the current Bitcoin bear market bottom. With sentiment so bearish, and the crypto consensus being that $4,000 resistance won’t easily be bested, could another powerful surprise movement shake up the crypto landscape?
Asset Bubbles Pop, Crash, Then Return to Mean

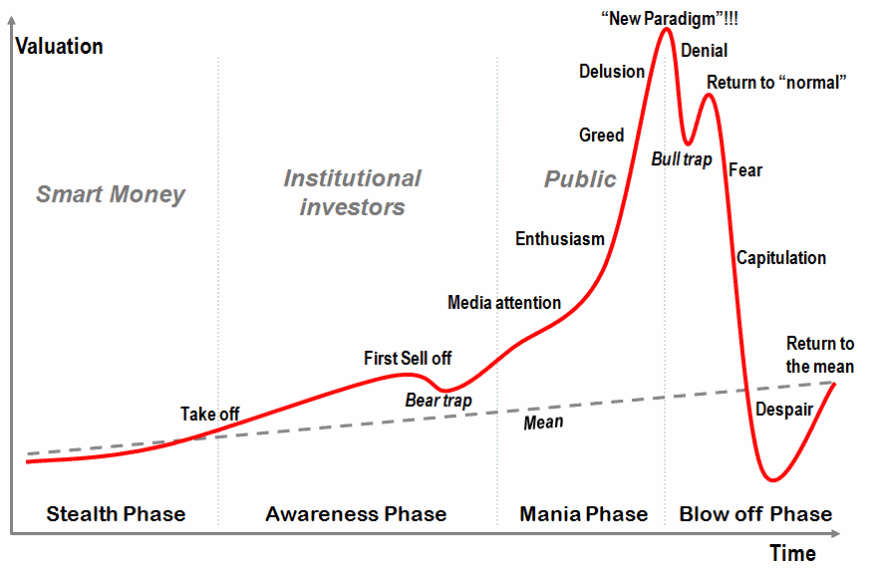
When viewing the commonly shared chart on bubble cycles put together by Dr. Jean-Paul Rodrigue of the Department of Global Studies and Geography at Hofstra University, and comparing it against the current Bitcoin chart, crypto could very well be in the “despair” phase.
If the crypto market is indeed in the despair phase, a return to mean may be in the cards. With Bitcoin spending so much time at prior support at $6,000, a powerful move up could potentially return Bitcoin to prices witnessed throughout 2018. However, should Bitcoin perform more closely to that of the 2014-2015 bear market, any strong moves up will be rejected back down to the current trading range and will stay there while accumulation occurs.
Copyright © 2023 iCryptome.com
- TRON’s Mission to Create an Internet for All, Defining Decentralization
- Find out: this is how much sleep you need to boost your mood
- EZ Blockchain launches a new business line EZ Energy, devoted to stranded, trapped and renewable energy
- Harmony Launches Staking, Becomes the First Sharded Proof-of-Stake Blockchain to go Live
- Ripple’s CEO Worried About Regulatory Backlash Over Facebook’s Libra Plan


