![]()

Ethereum price started a decent upside recovery against the US Dollar and bitcoin. ETH/USD could gain momentum once there is a break above the $121-122 resistance zone.
Ethereum Price Analysis
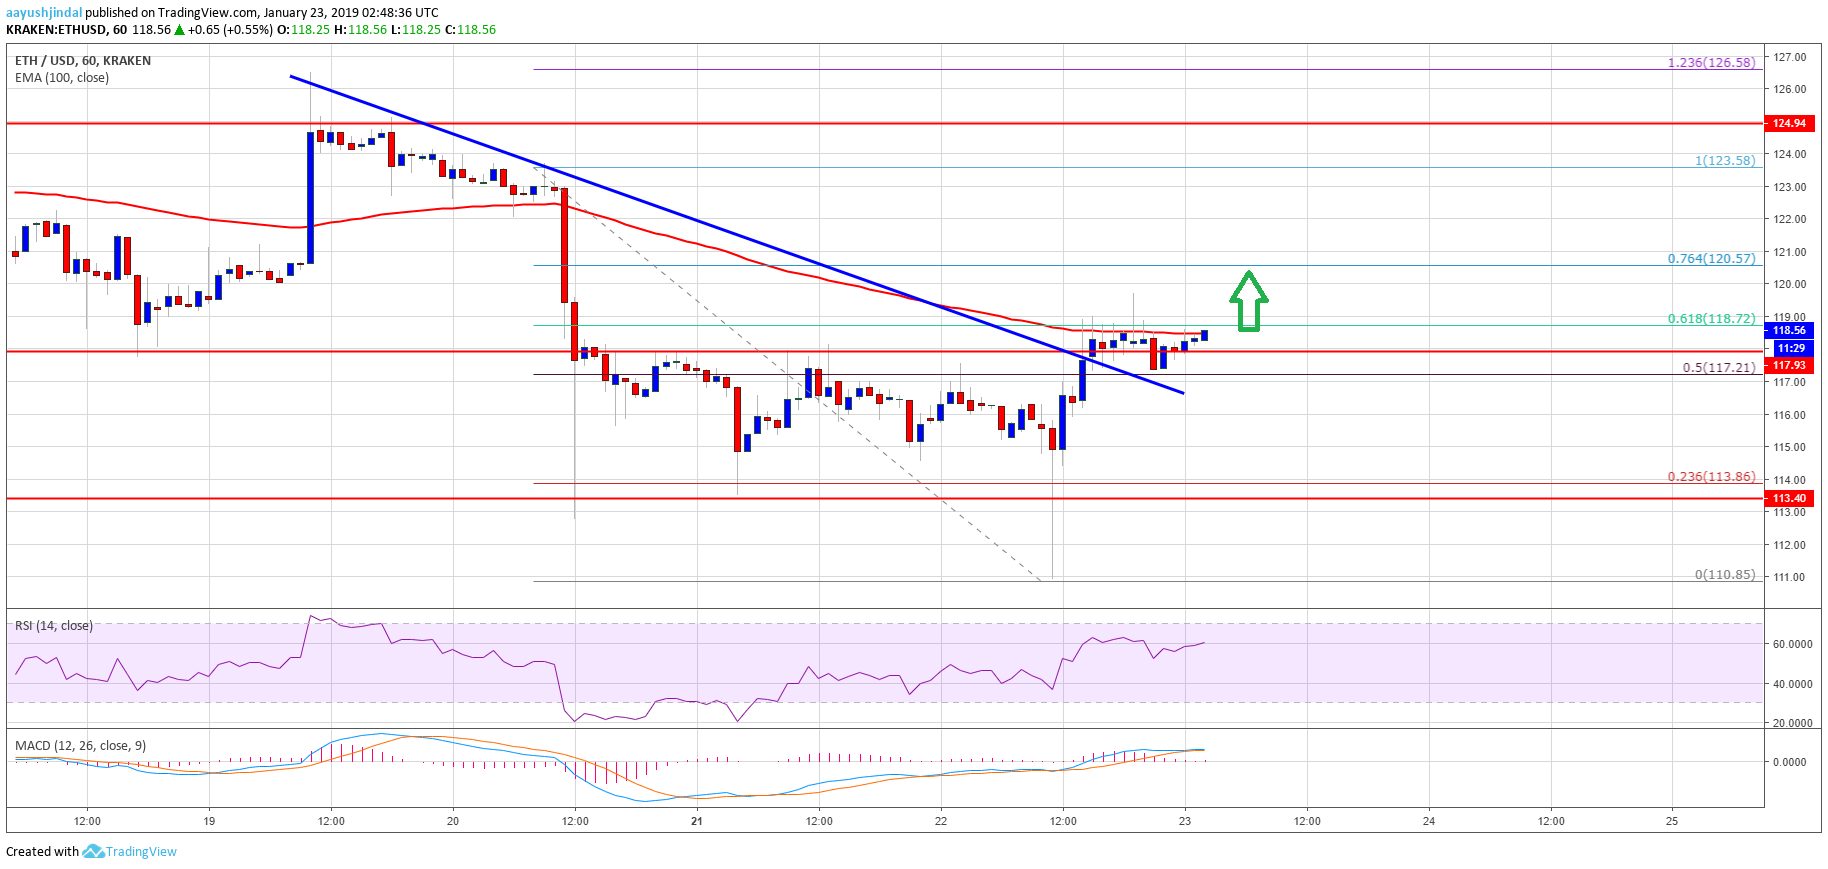
Recently, there was a downside extension below the $114 support area in ETH price against the US Dollar. The ETH/USD pair dipped below the $112 level and tested the $110-111 support area. However, buyers protected the $110-111 support area and later the price bounced back sharply. It traded above the $112, $114 and $116 resistance levels. There was also a break above the 50% Fib retracement level of the recent decline from the $124 high to $111 swing low.
More importantly, this week’s followed key bearish trend line was breached with resistance at $118 on the hourly chart of ETH/USD. The pair spiked above the $118 level and it is currently consolidating gains. Besides, the 100 hourly simple moving average is acting as a resistance near the $119-120 zone. The 61.8% Fib retracement level of the recent decline from the $124 high to $111 swing low is also near $119. Therefore, a proper break above the $119, $120 and $122 resistance levels could push the price further higher. The next important resistance is at $125, where sellers may emerge.

Looking at the chart, ETH price clearly bounced back nicely from the $110-111 support area. However, it must surpass the $119, $120 and $122 resistance levels to remain in a positive zone. If not, the price is likely to trim recent gains and trade back towards the $114 support level.
ETH Technical Indicators
Hourly MACD – The MACD for ETH/USD is slowly moving back in the bearish zone, with no major negative signs.
Hourly RSI – The RSI for ETH/USD is currently placed well above the 50 and 55 levels.
Major Support Level – $114
Major Resistance Level – $120
You must be logged in to post a comment.
Copyright © 2023 iCryptome.com
- Oraichain & Ocean Join Forces to Expand their AI Ecosystems
- Swiss Regulators: Crypto Firm Unlawfully Received Money from 37,000 Investors
- Could the Indecisiveness of Bitcoin Lead to Massive Crypto Markets Dump This Week?
- WEB5 Inu ($WEB5) launches the next-generation Decentralized Finance (DeFi) cryptocurrency
- Satoshi’s Games Launches Monstropoly, the Highly Anticipated, Blockchain-Based, Esports Play2Earn Game


