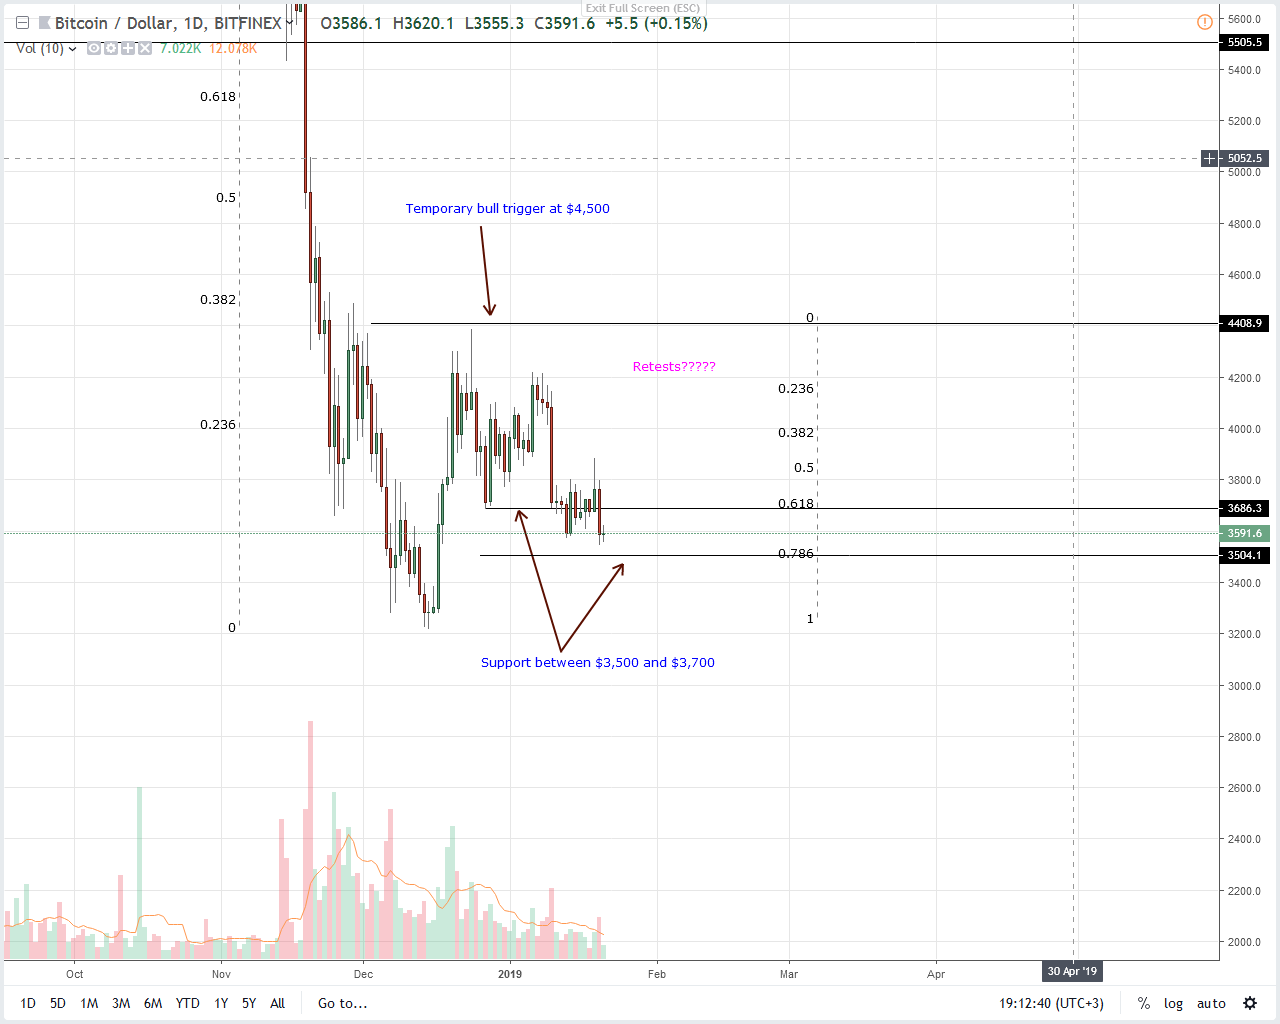
Despite bullish fundamentals, BTC continues to cede ground against the USD. At spot rates, prices are steady and trending within our support zone. Unless otherwise there are sharp gains above $3,800, sellers may snap back to trend.
Bitcoin Price AnalysisFundamentals
Wyoming may be the center of crypto attention thanks to their openness and embrace of new technology, but the real deal is the endorsement from the United Nations.
In their latest World Economic and Social Survey 2018 Report, a multinational organization made up of 193-member concluded that Bitcoin and cryptocurrencies, in general, were a new frontier in the finance. Of course, this is no brainer.
For a technology that is barely ten years, the underlying technology is not only disruptive but brings about efficiency, transparency and above all a new level of ownership. It is because of these inherent properties that the organization firmly believes that businesses can build new business models around the benefits of crypto and blockchain.
“The innovativeness of this system lies in the way in which the various parts combine to create the trust and guarantees that the traditional financial system derives from institutions and regulation…As such, the blockchain technology presents the possibility—a first in the field of finance! —that trust in institutions backed by a government can be replaced by trust in computer code.”
Candlestick Arrangements

Even with that, BTC is struggling against a strong wave of sell pressure. At spot rates, the coin is stable in the last day as prices hover around yesterday’s close. Nonetheless, our projection is bullish. Note that prices are yet to breach through our support zone.
When we paste a Fibonacci retracement tool, our immediate support lies between $3,500 and $3,700 flashing well with the 61.8 and 78.6 percent Fibonacci levels based off Dec 2018 high low. However, because of yesterday’s downturns and sharp losses from above $3,700, we recommend patience until after prices rally above $3,800.
After that, first targets will remain as before– at $4,500 and $5,000. The only bummer is if there is confirmation of yesterday’s losses and prices slide, complementing Jan 10 losses as prices dip below $3,500—the lower limit of our support zone. That likelihood will most likely catalyze further declines towards $3,200.
Technical Indicator
Average transactional volumes are still low. Yesterday’s bear bar for example printed above average volumes at 20k against 12k which is still low. Ideally, for a convincing break below or above, volumes should be above 35k rivaling those of Dec 17 (bull bar) or Jan 10 (bear bar).
You must be logged in to post a comment.
Copyright © 2023 iCryptome.com
- KPMG LLP Launches KPMG Chain Fusion To Help Manage Crypto And Traditional Assets Over Public And Private Blockchain Networks
- Bitcoin Unlikely To Get Ousted By Fast, Feature-Rich Crypto Assets
- Bank of Lithuania pits IBM against Tieto for new blockchain project
- French ‘cybercops’ Dismantle Pirate Computer Network
- Analyst: Bitcoin Faces Serious Demand Problem Despite BTC Holding Above $3,800 Support Level


