![]()

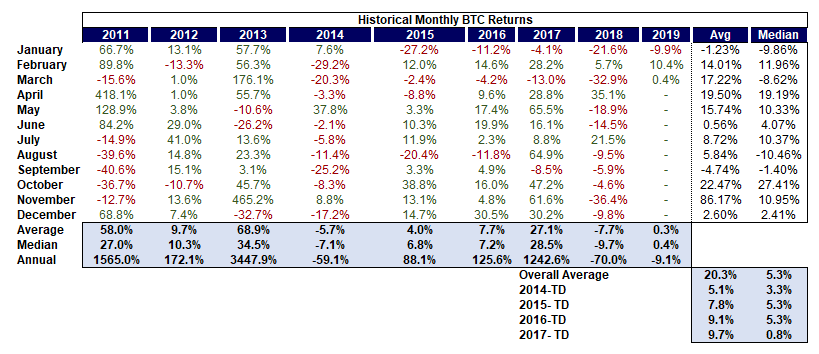
It took six months for the Bitcoin price to register a positive 30-day performance.
The world’s leading digital asset, which continues to be in its most extended bearish cycle, corrected 10.4% to the upside in February. It marked the third time in the past 12-months that bitcoin registered a profitable month, the last being July and April, which posted 21.5% and 25.1% returns, respectively.

BTC Performance Over the Years | Source: RPTR45
Twitterati RPTR45 noted that February was the lowest volatility month of bitcoin in comparison to July and April 2018. Per monthly data, BTC’s volatility rate in February 2019 was 2.70%. At the same time, July and April 2018’s volatility rates over their respective 30-day course were 3.28% and 4.53%. Also, on an annual basis, February was the lowest volatility month since April 2017 that posted positive BTC performance.
Did Bitcoin Bottom-Out?
The jury is divided over bitcoin’s next potential price direction. Some analysts believe that the digital asset is due for another bearish breakdown – perhaps towards $1,5000. At the same time, others say that bitcoin has bottomed out at $3,100, a level from where the asset bounced during the recent mid-December session.

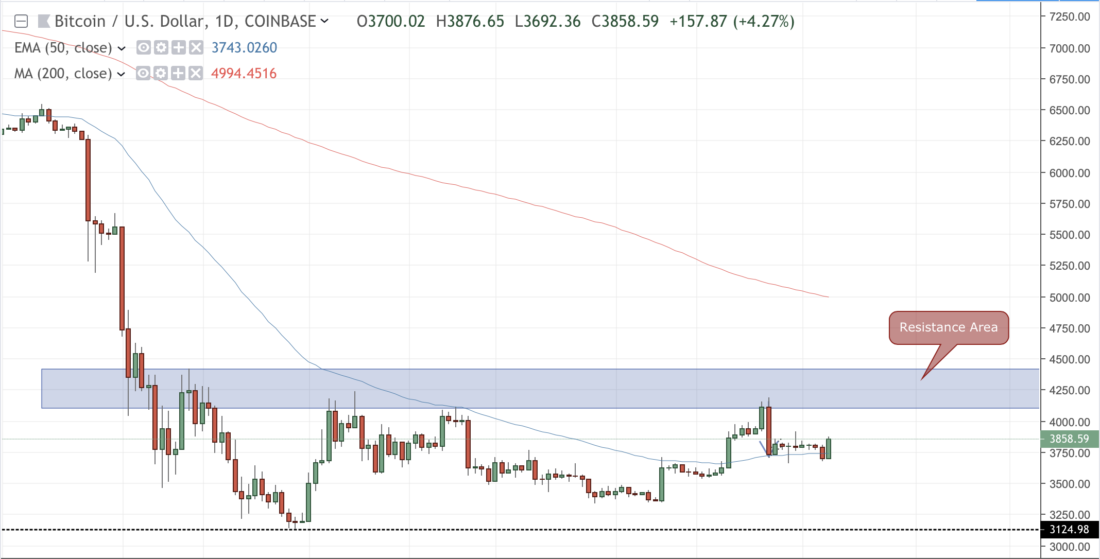
That big bitcoin resistance bar on 1D chart | Source: TradingView.com
Bitcoin Hasn’t Performed Well in 2018 But Analysts Say It’s Just Fine to Hold BTC
At the current rate, the bitcoin-to-dollar exchange price has corrected 23.55% since the 2018 low. Meanwhile, on five occasions, the pair have attempted to breach above 4100-4423 area. That pretty much puts the BTC market in a wait-for-the-break mood, where small investors wait for big whales to make drastic price moves. In reality, it is a $1,300-wide consolidation area confirming a significant interim bias conflict.
The reality is that the predictions are unpredictable for an asset whose 90% of the trades take place in unregulated markets. Last year, almost every major crypto investor had called $6,000 a bitcoin bottom. But what happened during the November 2018 bloodbath shot many of such analysis down. The bitcoin price was way below $6,000, and unless we reclaim that level for good, there is no chance we have bottomed out completely.
In the end, it is about an investor’s timeframe within which it wants to long or short its BTC positions. It brings us to the near-term price actions to realize potential opportunities that are closer. To that end, is March looking any better than February for Bitcoin?
March Analysis
Let’s leave the famous million dollar price predictions aside, and study bitcoin through its latest price actions.

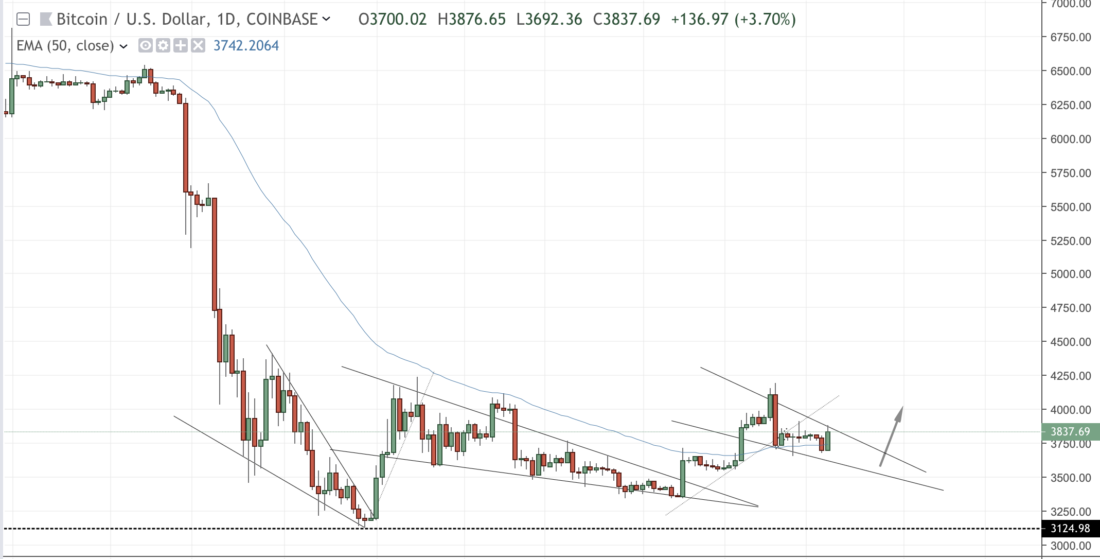
Source: TradingView.com
According to the TradingView.com chart above and data sourced from a regulated spot exchange Coinbase, one can notice how BTC earlier formed two falling wedge patterns, followed by a breakout action.
As of now, the bitcoin price action is looking to repeat the same pattern. It means that the price could trend lower during the first half of the March month while fluctuating between the parameters of its newly formed falling wedge. Upon reaching the apex of the wedge, BTC could likely see a drop in volume and volatility on the daily chart. And again, it could attempt an upside break towards the resistance area as discussed above – in the second half of March.
Frankly, March is looking as good as February based on the latest price behaviors.
Beyond March – and quite fundamentally – bitcoin pros outperform its cons. The institutional market is already in its final steps before it integrates BTC trading products wholly. That includes the launch of Bakkt, a bitcoin futures platform, and a potentially favorable outcome for the first bitcoin exchange-traded fund that is awaiting US regulatory approval.
Copyright © 2023 iCryptome.com
- 21Shares Unveils World’s First Crypto Staking Index ETP
- Bitcasino Announces XRP Support, Bringing Fast Transactions and Low Fees to the Game
- Unique Crypto Browser Offers Everyone the Opportunity to Mine with Ease
- Institutions Will Drive The Next Crypto and Bitcoin Boom
- Crypto Goes Narcos as Escobar Estate Launches New Stablecoin ICO


