Ethereum price is struggling to clear many hurdles versus the US Dollar and Bitcoin. ETH/USD may climb higher sharply once there is a close above $128 and $130.
Ethereum Price Analysis
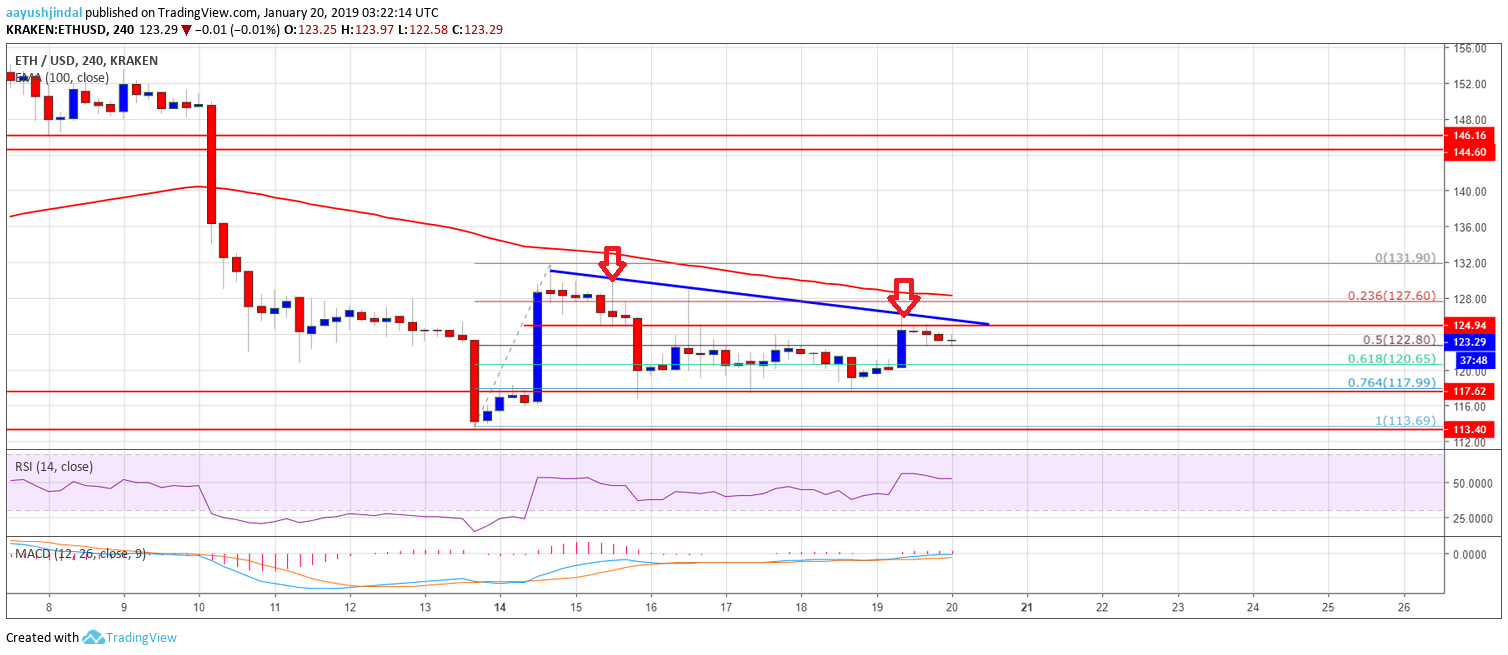
This past week, ETH price attempted to recover above the $132 and $133 resistance levels against the US Dollar. The ETH/USD pair tested the $133 level, but it failed to gain traction. As a result, there was a fresh decline and the price moved below the $130 and $125 support levels. There was a break below the 122 level and the price settled below the 100 simple moving average (4-hours). Moreover, there was a break below the 61.8% Fib retracement level of the last wave from the $113 swing low to $133 high.
The price tested the $117-118 support and found a decent buying interest. Besides, the 76.4% Fib retracement level of the last wave from the $113 swing low to $133 high acted as a support. Later, the price recovered, but it seems to be struggling to clear the $127 and $128 resistance levels. More importantly, there is a major bearish trend line formed with resistance at $125 on the 4-hours chart of ETH/USD. Therefore, the price must break the $125, $127 and $128 resistance levels to start a fresh upward move. The next key resistance is at $133, above which the price may climb towards the $140 level.

The above chart indicates that ETH price remains well supported near the $120 and $117 support levels. Having said that, a break above $128 is needed for a decent bullish wave.
Technical Indicators
4-hours MACD – The MACD for ETH/USD is slowly moving into the bullish zone, with a few bullish signs.
4-hours RSI – The RSI for ETH/USD is now placed nicely above the 30 level.
Major Support Level – $117
Major Resistance Level – $128
You must be logged in to post a comment.
Copyright © 2023 iCryptome.com


