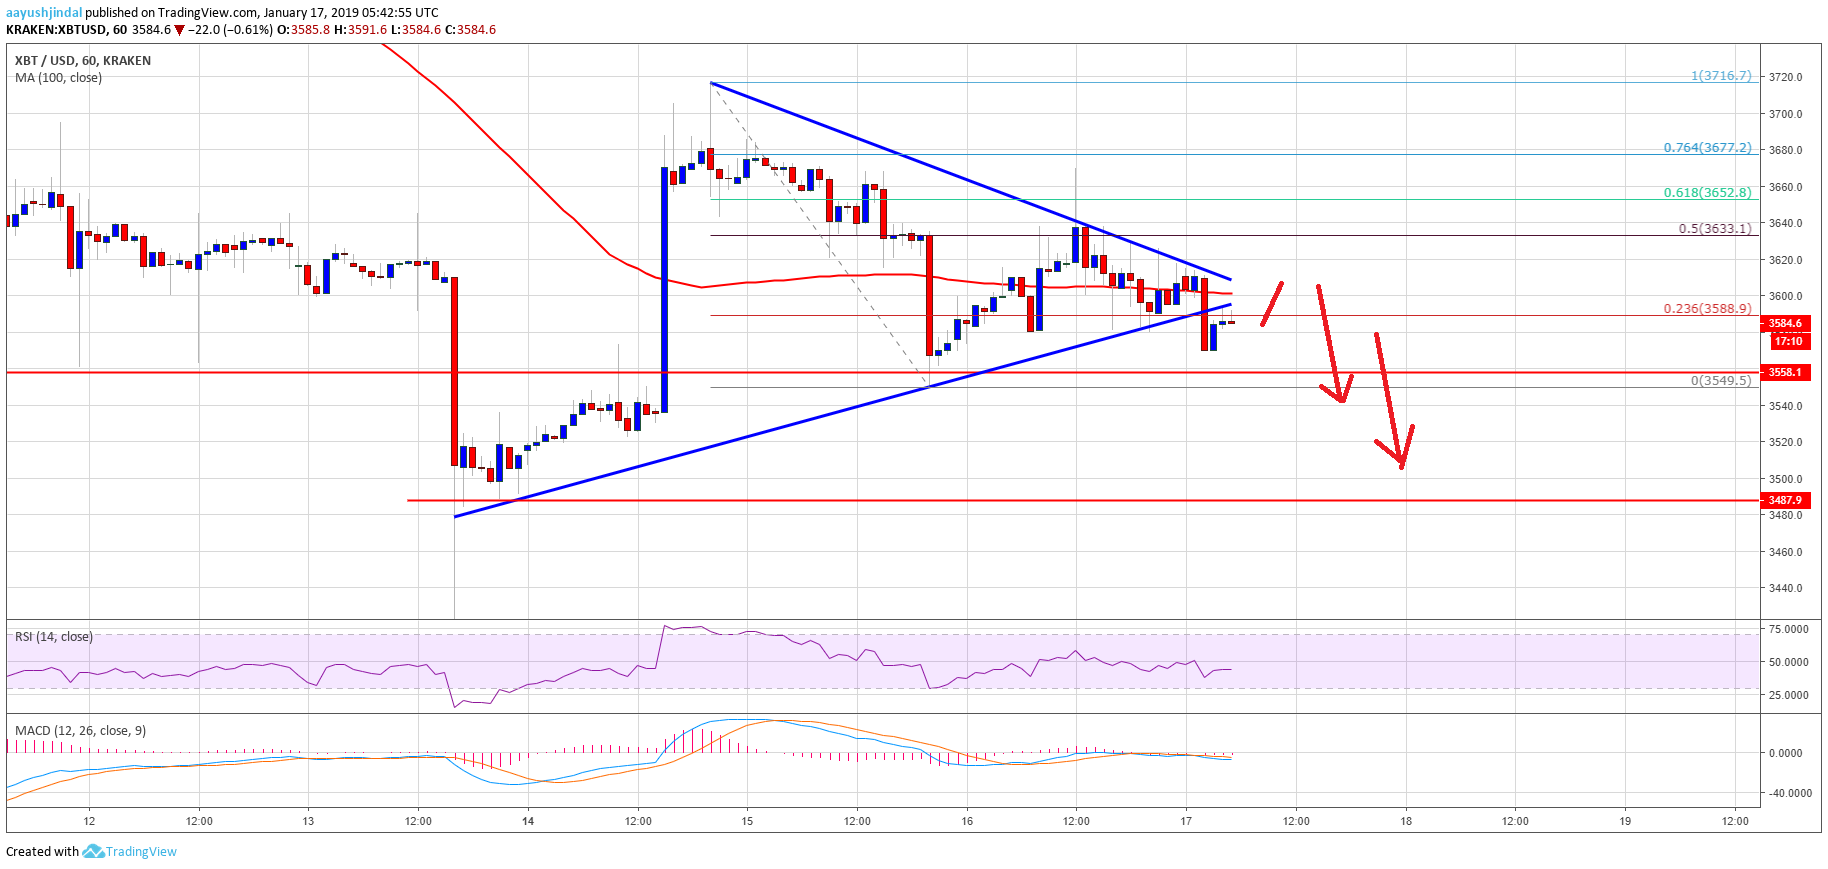
Recently, there was a decent support formed near $3,550 in bitcoin price against the US Dollar. The BTC/USD pair started a short term recovery and moved above the $3,600 and $3,620 resistance levels. There was also a break above the 50% Fib retracement level of the last side from the $3,716 high to $3,549 low. However, the price struggled to hold gains above the $3,650 level and the 100 hourly simple moving average. A clear rejection candle was formed near the $3,650 level.
Besides, the price failed to surpass the 61.8% Fib retracement level of the last side from the $3,716 high to $3,549 low. As a result, there was a bearish reaction and the price declined below $3,620 and $3,600. More importantly, there was a break below a major contracting triangle with support at $3,590 on the hourly chart of the BTC/USD pair. The pair is now trading well below $3,620 and the 100 hourly SMA. Should bitcoin gain bearish momentum below the $3,550 support, the price may tumble below the $3,500 and $3,450 support levels.

Looking at the chart, bitcoin price is showing a few bearish signs below the $3,620 and $3,650 resistance levels. Therefore, to start a decent upward move, the price must surpass the $3,650 pivot level. If not, there is a risk of a sharp decline below $3,500 and $3,450 in the coming sessions.
Technical indicators
Hourly MACD – The MACD for BTC/USD has moved back in the bearish zone.
Hourly RSI (Relative Strength Index) – The RSI for BTC/USD is now well below 50 level, with bearish signs.
Major Support Level – $3,550
Major Resistance Level – $3,650
You must be logged in to post a comment.
Copyright © 2023 iCryptome.com
- Huobi Launches Regulated Fiat-To-Crypto & Crypto-To-Crypto OTC Service For High Volume Traders
- CRYPTOCURRENCY TAX SOFTWARE PROVIDER, COINLEDGER, ANNOUNCES INTEGRATION WITH SOLANA BLOCKCHAIN
- Huobi Labs Launches “Winter 2019: The World’s Leading Project Incubation Program” During Its Silicon Valley Summit
- WAX and Topps Unveil Historic Blockchain Trading Card Partnership
- Polygon and Nukkleus to support Bollant Industries to revolutionize the recycling of municipal waste in India using blockchain


