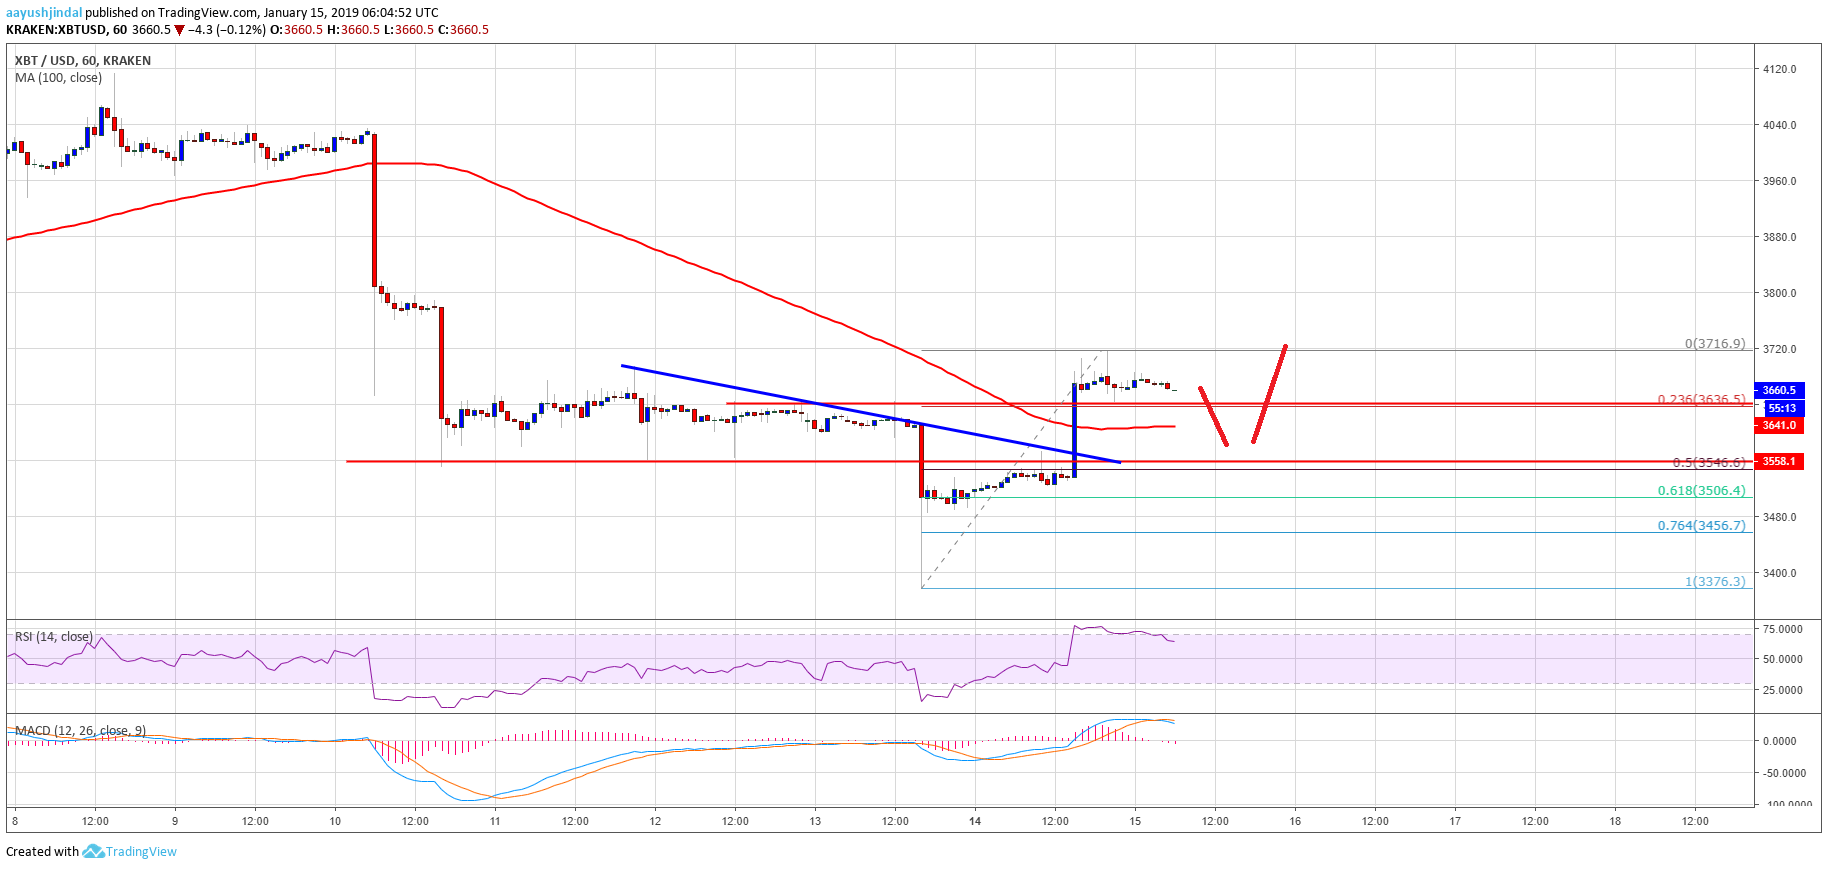
Recently, we saw a major downward move below $3,800 in bitcoin price against the US Dollar. The BTC/USD pair even broke the $3,560 support and the $3,400 pivot level. A low was formed at $3,376 and later the price started a decent recovery. It broke the $3,400 and $3,500 resistance levels to move into a positive zone. The upward move was convincing as the price settled above $3,560 and the 100 hourly simple moving average. Finally, there was a break above the $3,649 swing high, opening the doors for more gains.
Moreover, there was a break above a key bearish trend line with resistance at $3,560 on the hourly chart of the BTC/USD pair. The price tested the 1.236 Fib extension level of the drop from the $3,650 high to $3,376 low. A high was formed at $3,716 and the price is currently consolidating gains. An initial support is $3,640 and the 23.6% Fib retracement level of the recent wave from the $3,376 low to $3,716 high. The main support is near the previous resistance at $3,560. It coincides with the 50% Fib retracement level of the recent wave from the $3,376 low to $3,716 high.

Looking at the chart, bitcoin price recovered nicely above $3,560, but the price action seems to be a bit choppy. Therefore, there could be a few swing moves towards $3,560 before a fresh upward move.
Technical indicators
Hourly MACD – The MACD for BTC/USD is moving back in the bearish zone.
Hourly RSI (Relative Strength Index) – The RSI for BTC/USD is moving lower towards the 50 level, with a bearish angle.
Major Support Level – $3,560
Major Resistance Level – $3,720
You must be logged in to post a comment.
Copyright © 2023 iCryptome.com
- Climate tech crypto startup YES WORLD launches utility services portal, available in 80 countries
- This is what happens to your body if you quit smoking
- Harmony Launches Staking, Becomes the First Sharded Proof-of-Stake Blockchain to go Live
- Bitcoin Ended Its Longest Losing Streak Since… Forever
- Indian Official Tries to Condemn Bitcoin by Calling it a Shiny Toy But Ends Up Praising It Instead


