Contents
The best performer of the past seven days is UNUS SED LEO (LEO), which has declined by about 3% during the period. Cryptocurrency exchange Bitfinex has said that owners of LEO will benefit by access to higher allocations during its initial exchange offering compared to others who participate with other cryptocurrencies. Can LEO continue to outperform in the next few weeks? Let’s analyze its chart.
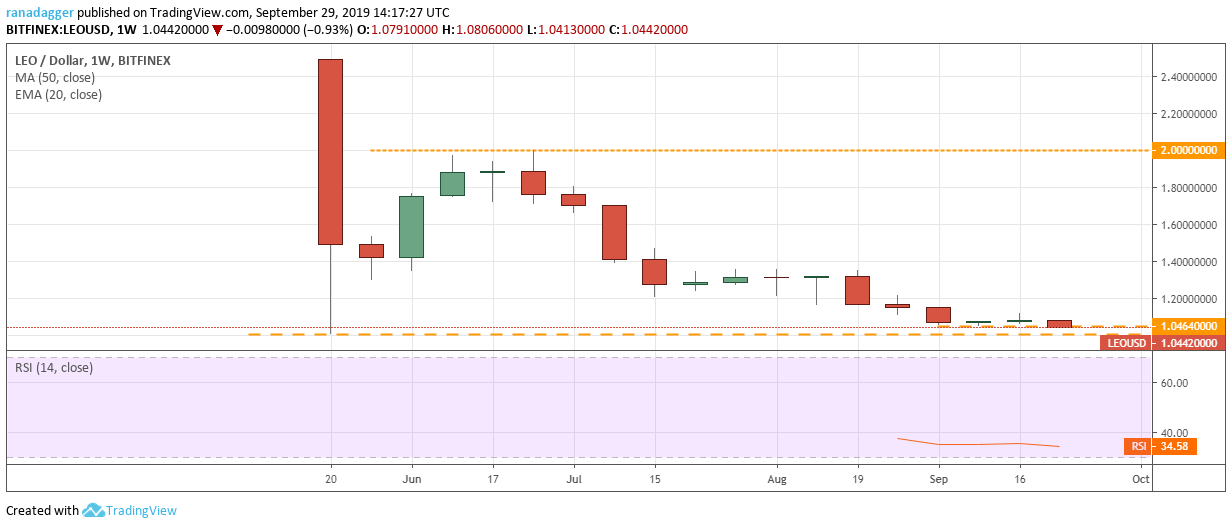
The LEO/USD pair has been under pressure since topping out at the end of June this year. It has consistently made a lower high and a lower low, which shows that traders are selling on minor rallies. The bulls have been attempting to stall the decline close to $1.0464 for the past three weeks. If successful, the pair might attempt a pullback that will face resistance at $1.36.
On the other hand, if the support zone at $1.0464–$1.0075 breaks down, it can drop to the next support at $0.80. The bulls are unlikely to buy aggressively if the price slips to new lows and the traders who own positions will bail out of their positions. We will wait for the trend to turn around before suggesting a trade in it.
Chainlink (Link) can now be used to pull reliable data about the various pairs traded on Binance. This can come in handy for various innovative decentralized finance applications. The listing on Kraken also helped put a floor beneath the prices. Can it stage a recovery from current levels? Let’s analyze its chart.
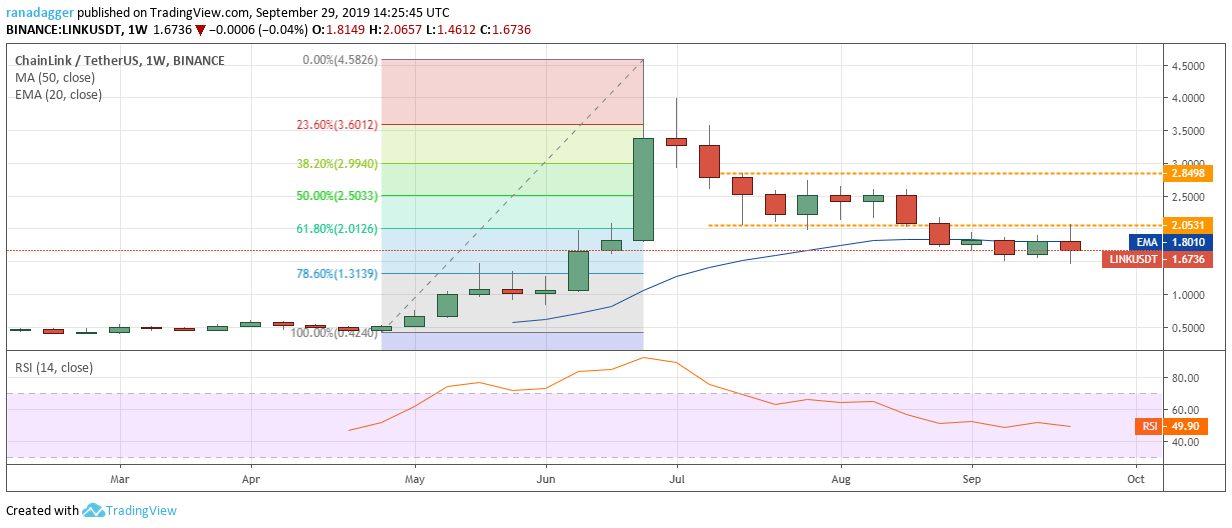
The Link/USD pair has been consolidating between the psychological support of $1.50 and the previous support turned resistance of $2.0531 for the past four weeks. The 20-week EMA has flattened out and the RSI is also close to the midpoint, which suggests a balance between buyers and sellers.
If the bulls can push the price above the overhead resistance of $2.0531, it will indicate buying at lower levels. The next level to watch on the upside is $2.8498, above which the momentum is likely to pick up. Conversely, if the bears succeed in breaking below the support of $1.50, a drop to $1.3139, which is the 78.6% Fibonacci retracement of the entire rally is probable.
However, we like the way the cryptocurrency has held its support in this pullback. Therefore, traders can initiate long positions on a close (UTC time) above $2.0531 with a stop loss of $1.40.
The Iota Foundation has teamed up with the Linux Foundation. Together they will work to advance the development of an interoperable solution set for IoT, Edge and Cloud integration. In another partnership, the foundation joined hands with the European Institute for Technology (EIT) and EIT Climate KIC, to connect and scale sustainable solutions across the continent. With fundamental news backing Iota (MIOTA), can it rally from the current levels? Let’s study its chart.
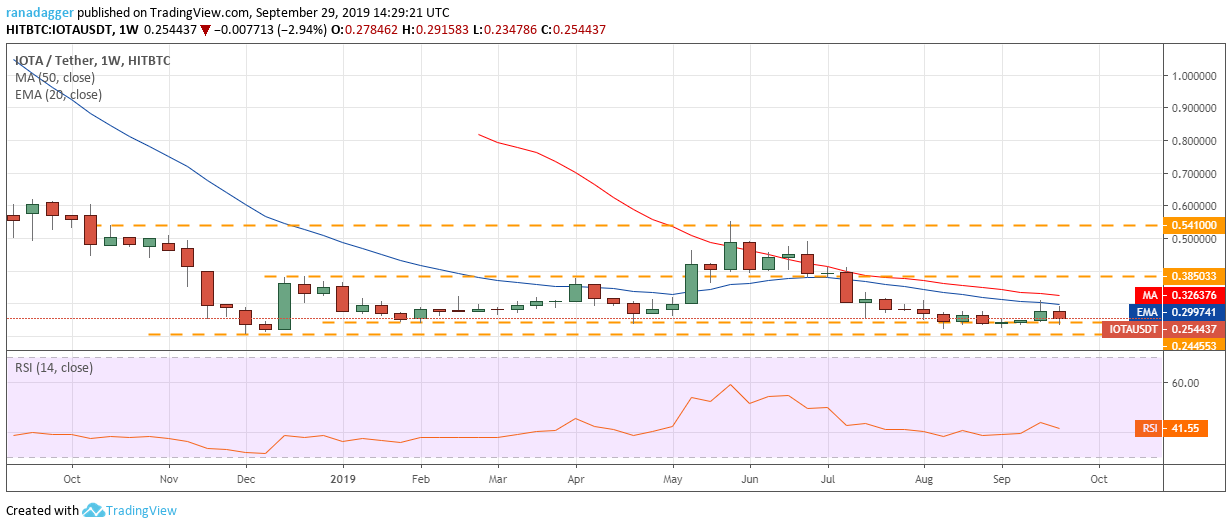
The bounce from the $0.244553–$0.207622 support zone fizzled out at the 20-week EMA. Both moving averages continue to slope down marginally and the RSI is in negative territory, which shows that bears have the upper hand.
If the price slides below the support zone, it will be a huge negative because the next support on the downside is way lower at $0.104073. However, as the bulls have been defending the support zone for the past six weeks, the possibility of a breakdown is low.
Conversely, if the bulls defend the zone once again and the IOTA/USD pair climbs above the 50-day SMA, it will signal demand at lower levels. On crossing above $0.385033, a move to $0.541 is possible. There are two ways to trade this. Either buy on a rebound off the support zone, which gives a close stop loss, or wait for the price to rise above $0.335, which shows that the bulls are back in action.
Ripple, the company behind XRP has acquired Logos Network, a startup that focuses on speed and scalability. The Logos team will join Xpring to develop decentralized financial products. XRP has been a huge underperformer in the past few weeks. Can it stage a turnaround or will it continue to correct? Let’s analyze its chart.
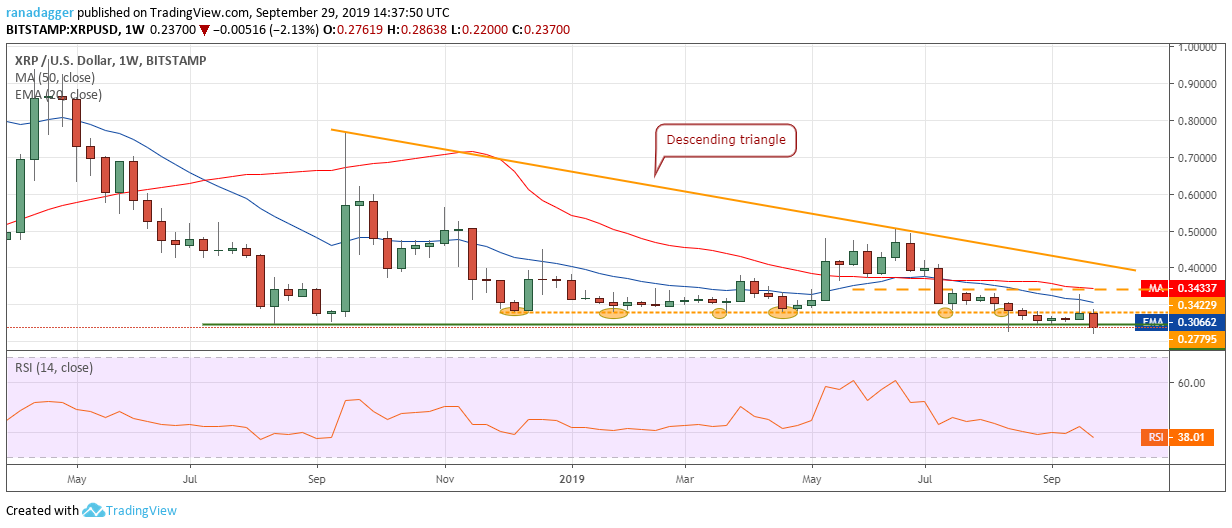
The pullback in the XRP/USD pair reversed direction from just below the overhead resistance of $0.34229. This shows selling by the bears on minor rallies to strong resistance levels. The bears are currently attempting to sink the pair to new 52-week lows.
If the pair dips and sustains below $0.22, it will complete a descending triangle, which is a bearish pattern. The next support to watch on the downside is $0.19 and if that also cracks, the downtrend can extend to $0.13. The downsloping moving averages and the RSI in the negative territory also show that bears are in command.
Our bearish view will be invalidated if the pair bounces strongly from the current levels and scales above $0.34229.
Binance added support to Tezos (XTZ) and trading commenced on Sept. 24. However, the bounce due to the positive news was short-lived as traders used the opportunity to lighten up their positions. Tezos was the fifth-best performer of the past seven days. It slipped about 16% during the period. How does it look on the chart? Let’s find out.
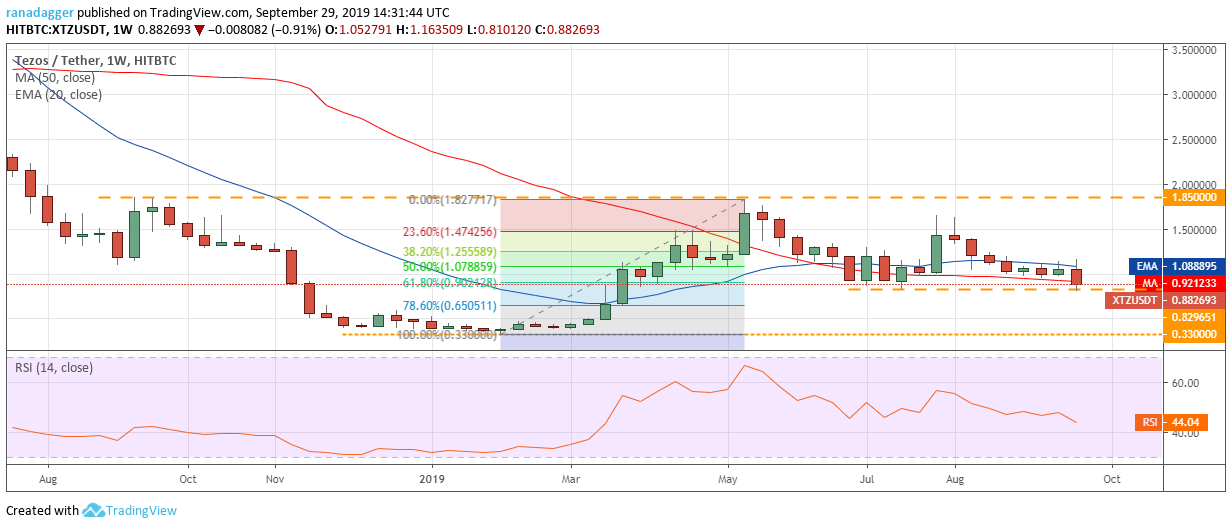
The bulls are attempting to defend the critical support of $0.829651. If this support breaks down, the next stop is likely to be $0.650511, which is the 78.6% Fibonacci retracement of the rally and if that level also cracks, a drop to $0.33 will be in the cards. That will bring the large range of $0.33–$1.85 into play.
Conversely, if the XTZ/USD pair bounces off the support at $0.829651, it will act as a higher low. Above $1.20, a rally to $1.85 is likely. If bulls propel the price above this resistance, a new uptrend is likely.
The market data is provided by the HitBTC exchange.
Copyright © 2023 iCryptome.com
- Ideanomics MEG Announces Multiple Orders from Zhitong 3000
- Bitcoin Miners Capitulated in Dec 2018 and it Could Signal the End of Bear Market
- Find out: this is why you should wear loose-fitting boxer shorts
- Gridex Protocol: Integrating First Fully On-chain Order Book For a New Generation of DEX
- How to launch an NFT or DeFi project without technical skills – Unity Project


